


Floods represent one of the most common and most impactful natural disasters worldwide. During the first two decades of the 2000s, floods alone caused $651 billion in economic damage and these losses are expected to increase further in the future due to climate change, economic growth and urbanisation. Effective flood management requires accurate knowledge of the post-event situation in order to support and develop timely and efficient response plans.
However, collecting information in situ to map flooded areas can be inaccurate and impractical, especially over large areas. In this context, satellite remote sensing proves to be a valuable support tool. Thanks to the numerous on-orbit sensors that acquire data at different spectral and spatial resolutions, up-to-date synoptic observations of large areas can be obtained in a short time.
In the field of optical remote sensing, the scientific literature suggests several spectral indices for the identification of flooded areas, including the Normalized Difference Water Index (NDWI) and the Modified Normalized Difference Water Index (MNDWI). Although their mapping ability is widely recognised, it is at the same time known that several factors can interfere with the correct identification of water such as the presence of dense clouds, snow, ice and shadows.
In order to reduce errors and improve the expeditious detection of river floods, this study proposes an approach that integrates optical satellite products and geomorphological analyses based on Digital Elevation Models (DEMs). This method was tested in the context of the Piave River flooding event in October 2018, caused by storm Vaia, which had a significant impact on the northeastern regions of Italy. In the study, optical images acquired by the Sentinel-2 sensor were used, one of the leading non-commercial optical sensors with a high revisit frequency (5 days at the equator and 2-3 days at mid-latitudes due to the combination of Sentinel-2A and Sentinel-2B orbits), which makes it suitable for flood mapping. In addition to the already mentioned MNDWI and NDWI, the Normalised Difference Turbidity Index (NDTI) was added to identify pixels characterised by very turbid and sediment-laden water. Through the segmentation of these spectral indices (analysed both separately and combined) and the application of appropriate thresholds, preliminary maps of flooded areas were obtained. At the same time, the Geomorphic Flood Index (GFI), a DEM-derived hydrogeomorphological descriptor capable of identifying the areas most likely to be reached by fluvial flooding, was estimated.
It was chosen for its reliability, as it was specifically formulated to identify flood susceptibility and was found to be the index with the best performance in comparative analyses carried out in different regions of the world. Through the segmentation of the GFI, the map of areas geomorphologically prone to flooding was obtained for an assigned return period (chosen according to the flood event considered). The superposition of the two maps, the satellite and the geomorphological, resulted in the final product consisting of the pixels found to be flooded in both analyses. The results of the study showed that the integration of these information layers improves the identification of the areas affected by the flood phenomenon by significantly reducing overestimation errors caused by false alarms such as clouds, shadows and wet vegetation (Figure 1).
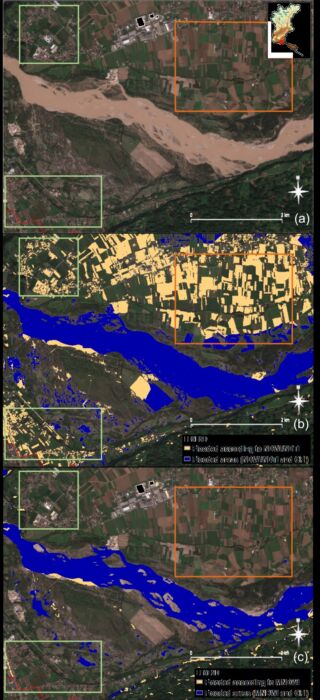
This new approach generates a more robust mapping than traditional approaches based only on the segmentation of a single spectral index.
In conclusion, the proposed method allows for reliable and rapid mapping based on the use of free and easily available data, enabling the investigation of large areas. This tool, therefore, can be of great use in providing a timely and accurate representation of post-flood conditions, supporting the coordination of initial field operations and enabling a preliminary damage estimate.
For more information: Samela, C., Coluzzi, R., Imbrenda, V., Manfreda, S., & Lanfredi, M. (2022). Satellite flood detection integrating hydrogeomorphic and spectral indices. GIScience & Remote Sensing, 59(1), 1997-2018. https://doi.org/10.1080/15481603.2022.2143670.
This contribution was written in collaboration with IMAA-CNR researcher Caterina Samela.


